Fair Oaks Reflections – Issue 2
27 December 2018
A combination of negative credit headlines and a change in investor expectations regarding future US interest rates has resulted in a significant increase in volatility in the US loan market in what traditionally are slow weeks around the Thanksgiving holidays and pre-Christmas period.
While the US loan market does not appear to have suffered the same amount of stress as it did in late 2015 and early 2016, we believe there are meaningful similarities between the two periods.
Background – US loan market investor universe
Bank loan investors are predominantly long-term, closed-ended vehicles such as collateralised loan obligations (“CLOs”). Since August 2012, long-term, non-mark-to-market capital provided by CLOs has represented between 41% and 51% of the US loan market. Open-ended loan funds and ETFs have accounted for between 12% and 23% of the market during the same period(1).
Despite their small relative size, open-ended funds and ETFs have the potential to represent a large percentage of trading volumes at times of volatility because of the shorter-term nature of their investors. This means that they can have an outsized impact on average US loan prices.
Loan volatility during late 2015 and early 2016
December 2015 saw unusually high outflows of $5.9 billion from loan funds and ETFs(2) and continuing outflows in H1-2016 saw their share of the US loan market reach a 5-year low of 12% by June 2016(3). US loan prices fell to an average low of 89.3c in February 2016, although as can be seen from the chart below, this was largely driven by loans to borrowers in the energy sector which fell to an average price of 48.3c(4). As it is also evident in Figure 1, the US loan market recovered quickly.
Figure 1: Credit Suisse Leveraged Loan Index – Average Loan Price

Loan volatility during Q4 2018
Loan fund outflows in November 2018 reached $4.1 billion(5), the largest monthly selling volume since December 2015. Outflows continued in December reaching another weekly record of $3.3 billion for the week ended 19 December 2018(6). Bloomberg reported that daily volumes for the Invesco Senior Loan ETF reached 29 million shares on 20 November 2018 (Thanksgiving week), a record trading day for the fund (8x 5-year average daily volume), resulting in the largest discount to NAV in the history of the ETF(7).
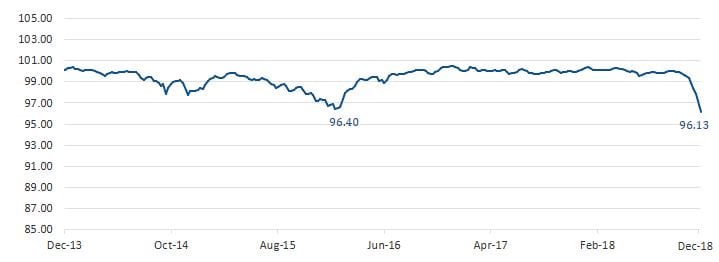
Current average US loan prices, however, seem to indicate a lack of forced selling or stress when compared with early 2016 (average US loan price of 94.6c on 20 December 2018 compared to 89.3c on 25 February 2016(8)). A more detailed analysis shows that once we exclude the energy sector, trading levels are reasonably close in both years. Looking only at higher-quality BB-rated loans (Figure 2), the 20 December 2018 average closing price of 96.1c was actually lower than the 96.4c average price on 11 February 2016.
Figure 2: Credit Suisse Leveraged Loan Index (BB sector) – Average Loan Price
Conclusion
The bank loan market has an unusual investor base, with a majority of long-term investors relatively insensitive to mark-to-market movements, and a minority of short-term retail-driven open-ended funds and ETFs. We believe that recent, extreme, outflows from open-ended funds have been driven by sentiment or non-fundamental reasons such as changes in interest rate expectations or volatility in broader markets.
We believe that the current US loan market weakness is largely technically driven and is in fact similar to the volatility in early 2016, which proved to be relatively short-lived. This suggests that the US bank loan market may currently present attractive opportunities for investors.
FOOTNOTES:
(1) Refinitiv, Leveraged Loan Monthly – US: November 2018. (2) S&P Global Market Intelligence. (3) Refinitiv, Leveraged Loan Monthly – US: November 2018. (4) Credit Suisse Leveraged Loan Index. (5) S&P Global Market Intelligence. (6) S&P Global Market Intelligence. Lipper weekly reporters. Previous records outflows were $2.53 billion during the week of December 12th 2018 and $2.12 billion in August 2011. (7) Bloomberg. (8) Credit Suisse Leveraged Loan Index.